‘Buy low, sell high’ has a strong connection with the natural cyclic changes of the market. And to take benefit from such market changes, one must understand the natural behavior of markets.
But how the natural behavior of markets looks on the charts? That’s the question we often get asked by the readers.
Well, by natural behavior, we generally mean the fluctuations in price and the natural principles we used to read them. And one such precious principle of nature is the ‘TREND SQUARE.’ Because it reads and reveals the market order in a way that one can take advantage of the ‘Buy low & Sell high’ opportunities when they come.

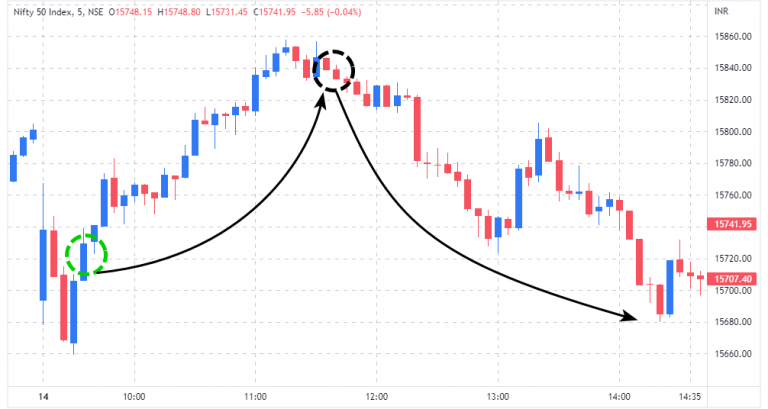
So, let’s look at today’s Nifty Intraday 05-minute chart to see how the ‘Buy low & Sell high’ opportunities were easily tradeable using the TREND SQUARE principle.
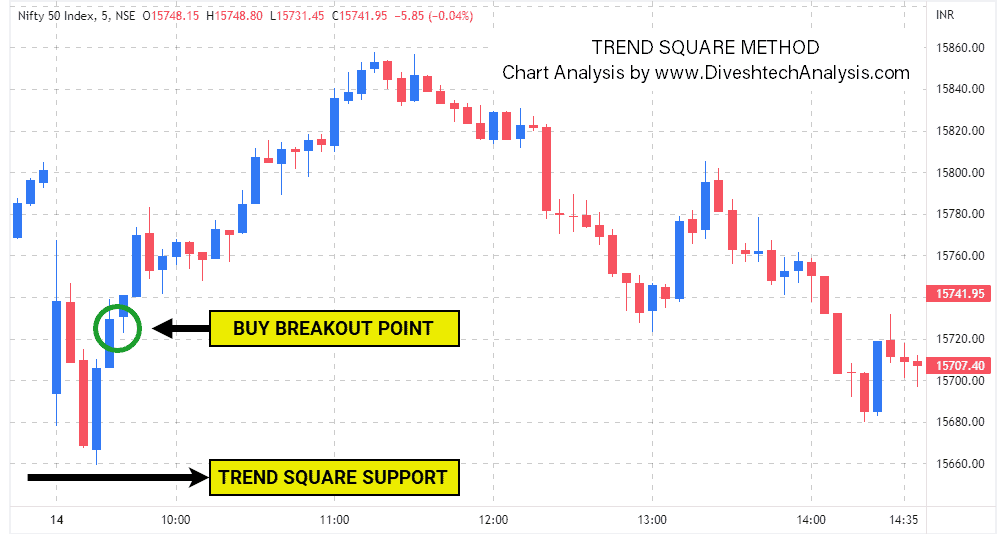
First, the Nifty opened a gap-down. Then, it took support from the TREND SQUARE level and moved higher, which was a good opportunity to go long on the break of the green oval point.

Then around 11:00 am, it faced the resistance precisely at the TREND SQUARE resistance level and moved down, which was a perfect opportunity to go short on the break of the black oval point.
So, that’s how the ‘Buy low, Sell high’ works; we need to track the trend from both sides (up & down) to grab the early opportunities as they arrive. And one of the simplest ways to do that is by understanding the natural behaviour of the price movements.

Below are a few more posts to help you understand the process of the TREND SQUARE method.
How Gann’s Square Method Played a Crucial Role in Today’s Fall?
Bull-To-Bear Game In The Nifty Index
A Classic example of How fast Trends and Positions change in Day trading
