Breakout trading is ideal for finding entry and exit points in the markets.
But a couple of times, false trading breakouts happen. And you get stuck in such a trade.
Many times you face such a problem. Then today’s post is for you. I will share a few Practical rules to avoid fake trading breakouts.
First, let’s learn what trading the breakout means.
The breakout means prices move over the resistance or move below the support level. And proceed in the breakout direction.
Techniques For Trading Breakouts
Tip 1# Follow Closing Basis Prices
A closing price carries more weight than a high-low price. Because the close price gives more reliable signs of the market’s shape.
The closing price was the only price listed in the newspaper before computer trading.
Count breakout as valid – When the price gets close above or below your Resistance/Support point.
When prices cross. And don’t give a close above or below your Resistance or Support level, don’t count it as a valid breakout.
Let’s look at an example.
In the below chart price is getting Resistance at the blue Angle/Trend line.
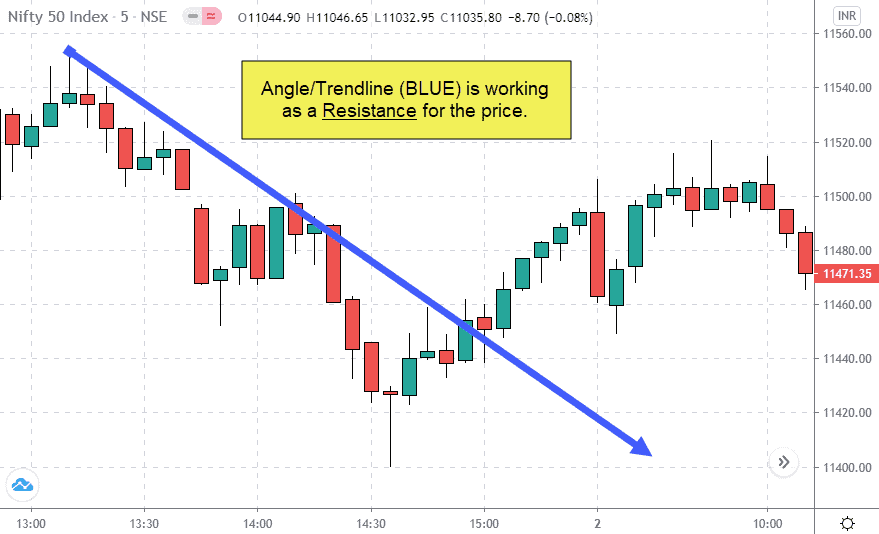
After 2 pm, the Three-time price breaks the Angle/trend line. But didn’t close above it and moved down.
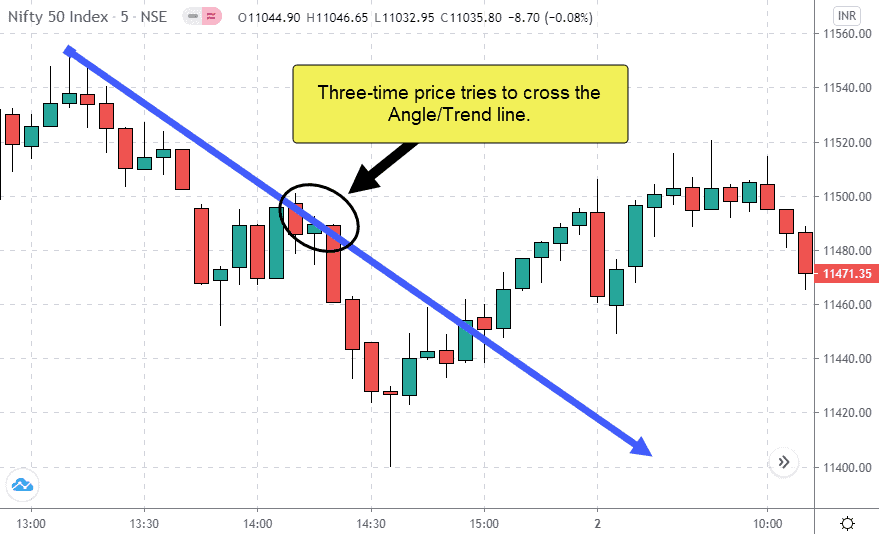
Then before 3 pm, again, the price breaks the Angle/Trendline. And now, the price makes the close above it.

And price moves higher on closing up the Angle line because closing prices matter most to market members. That’s why the price breakout around 2 pm gets failure. And prices reverse back to the original trend. Many traders get stuck on the wrong side because they give more preference to high low prices.
Tip 2# Wait for a Strong Bar After the Breakout
Here you have to track the strength of the closing bar. To measure the strength rule is simple.
- Candle/Bar close near the high is a sign of powerful strength.
- Candle/Bar close near the low is a hint of weak strength.
Let’s look at an example. In the chart below, the Breakout happens above the horizontal blue resistance line.

The price failed to move up because the closing bar strength was weak.
The next three bars were also weak in strength. And finally, the price moves down to hit a new low.
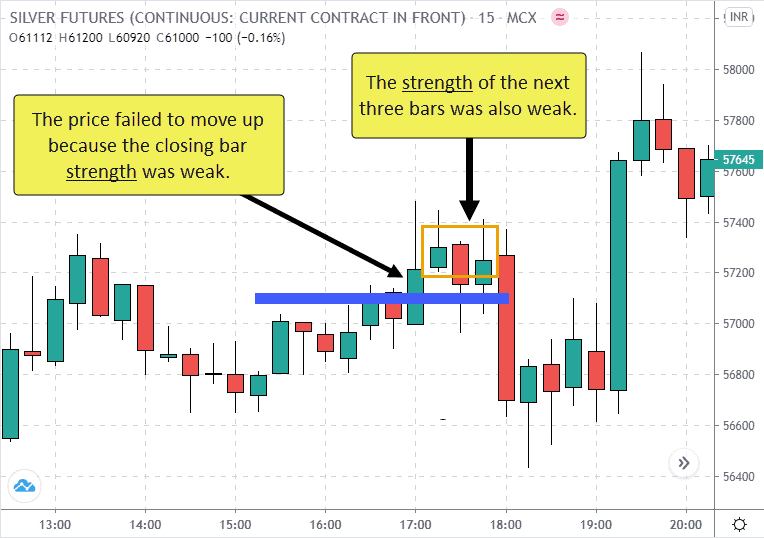
The strong bar rule after the Breakout saved us from taking the long position on false breakout.
Advice: Try to analyze a few more bars after the breakout bar.
You can practice the rule in the same way by scanning the High, Low and closing prices of bars.
Tip 3# Make a Shift from a High to a low Time frame
A shift from a high to a low time frame means first finding the breakout on the large time frame and then moving to the short time frame to view more breakouts.
Let’s say you find the Buy trade Breakout on an hourly time frame.
Then you will move to a lower time frame (30, 15, or 5 min chart) to locate more breakouts.
Let’s look at an example. In the below hourly GOLD chart, a SELL trade breakout happens under the blue Angle/Trend line.

After the Breakout, I went on the 5-minute time frame chart and used the same Gann method to locate the extra breakout.
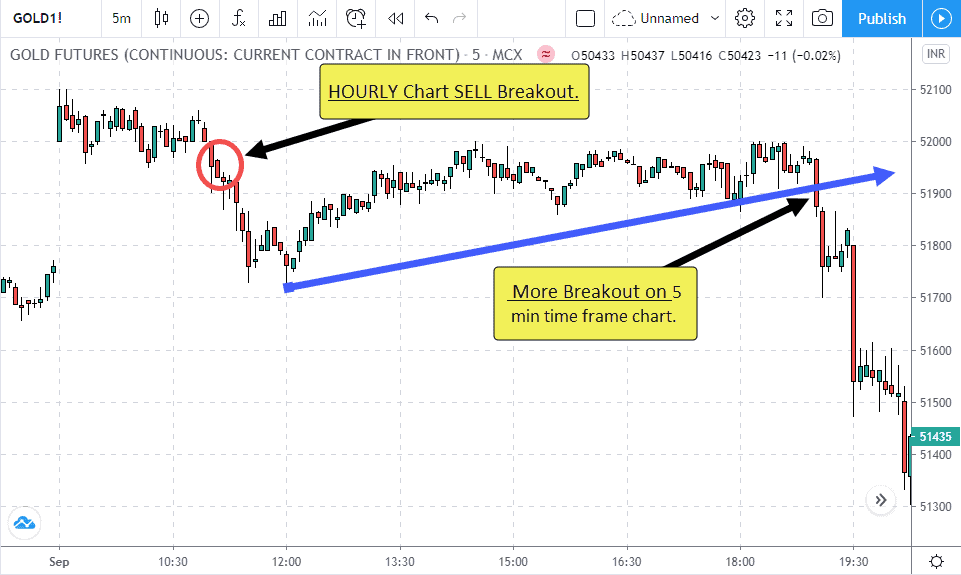
And near 7 pm on the lower time frame, I got a further breakout. That ups my confidence to take the trade. If you beginner, you can use this process to be more sure about your breakout trades.
Conclusion
So you’ve learned now. The closing price is more critical than high or low prices.
Don’t jump to take a trade on the penetration of the Resistance or Support level. Wait for the price to give CLOSE above or below your breakout point.
To make your entry more right, practice the trend strength bar process. It’s easy & powerful when applied in the right manner.
In case you’re a beginner and want to be more sure about the breakout. Then first, let the price make a breakout on a bigger time frame. Then move on to the lower time frame to locate the further breakout.
I hope this article will help you to identify valid breakouts for your trades. If you LIKE the article, kindly share it on your favourite social media platform.
