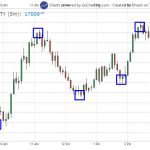
In our last analysis on this stock, we predicted that the stock Voltas have reached its Reversal area, & we got the excellent Entry on 29th Jan, when the stock made the low of 528.50 & from there, it zoomed all the way to 557.70 levels, which is nearly 5% gain.

Now, the stock is approaching the Resistance area, where we may see a pullback.
If it successfully goes past that resistance area, then the more strength in the present up-swing will be seen & then buy-on dips will be an excellent approach & if it fails to cross that resistance area, then again, it can witness lower levels.
In the above chart, I have tried to show you the same by marking a zone, as the actual method, has not been displayed due to security purpose.As this is the multi-dimensional view & presentation of analysis, I will make another post & update on this, if we get a breakout from the resistance area.
The 559-566 will be a critical area to watch out, as close above that can show the levels near 585/600.
Note: The above-mentioned price projection & other Information are for educational purposes only.


