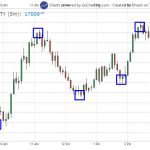
The stock ACC is showing signs of reversal when it was at its lower levels in Jan last but was ignored by me due to a Budget event.

Now, the stock is approaching a critical area of 1430, above which we can see it rallying towards higher levels.
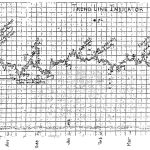
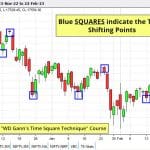
In the above chart, I have tried to show you the same in an angular way, as the actual method has not been displayed due to security purposes.
Close above 1430 will trigger the Breakout & Probably, and a higher level can probably be seen around 1475-1490 or even more in coming sessions.
Note: The above-mentioned price projection & other Information are for educational purposes only.


