Last week below 11030 Gann support level Nifty did our 2nd weekly target. The Index ended the week with 61.85 points loss.
Next week we can see Big trending move in Nifty, as one crucial cycle is getting culminated. Additionally, a couple of long terms Cycles had hit there Point already in the last week.
Few other minor Time Cycles will reach there Point in the coming week. Overall we can expect grand fluctuations in the coming weeks.
Nifty Hourly Chart
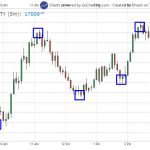
On the hourly chart, Nifty bulls need to trade above 11100 for the move towards 11160/11230/11310 levels.
Bears in Nifty will get the chance below 10980 for the move towards 10920/10850/10770.
Nifty Daily Chart
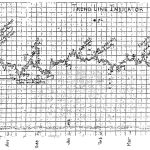
I have drawn the unique Gann Angle line, acting as Support.
On Nifty daily chart 11185 level is critical Resistance. Any sustainability or close above it will add further Force and energy on the upside.
Above 11185 Nifty can rise towards 11235/11300/11420 levels.
Nifty Weekly Chart
Nifty Weekly Analysis For 19-23 Aug Week
Last week in this section of Nifty Analysis for week, we discussed. We can see more upside can in the coming days. As on the weekly charts now forces are a bit in favor of bulls but we need to look for more additional confirmations.
Due to two day’s holiday, last week was dull, and the Nifty Index was consolidating around 11100 on the upper side and 10900 on the lower side.
At present on weekly chart view is still the same 10800 is the crucial Support for buyers. Further rise is expected, but again, additional confirmations are missing.
In the forthcoming week, 20 & 22 August are the critical dates.
Nifty Weekly Trading Levels
Next week 11100 will act as Resistance above which move towards 11150/11215/11330 can seen.
While Support is likely to come at, 10970 below that move towards 10920/10855/10740 can be seen.
Note: Above mention price projection & other Information are for educational purpose only.


