Last week first above 11100 Nifty almost did our 1st weekly target.
Later on in the week below 10970 Gann support levels Nifty did our all the three targets on the downside.
In the previous week also saw wide fluctuations in the prices which were part of the Time cycles. About that, we discussed in the last analysis.
If we go deeper, then we will find USD/INR is also approaching resistance area.
Additionally, now next crucial Cycle for both Nifty & USD/INR will come in mid of September.
We already know about this correlation. So in coming days, we may see upside in Nifty Index and downside move in USD/INR pair.
I had posted USD/INR as Gann and Natural Cycles, which can be seen by visiting here.
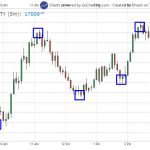
Nifty Hourly Chart
On the hourly chart, Bulls in Nifty will get active above 10915 for the move towards 10975/11055 levels.
Nifty bears will get the chance below 10750 levels for the down move towards 10690/10610.
Nifty Daily Chart
Last week after breaking the Gann support angle line on Daily chart, Index falls around 250 points.
In the previous week, Nifty also failed to trade above 11185 resistance levels, as last week high was around 11145 levels.
Now for up move Bulls need to close above 10900 levels on Daily chart for showing some strength.
Bears on the daily chart will get active below 10680 for further downside towards 10620/10540 levels.
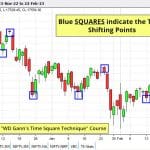
Nifty Weekly Chart
Nifty Outlook for the Week 26-30 Aug
Last week in this section of Nifty Outlook for the week, we discussed. Nifty Index was consolidating around 11100 on the upper side and 10900 on the lower side. Further rise is expected, but again, additional confirmations are still missing.
After breaking below 10900 levels, Nifty fell around 250 points. Nifty did not confirm further clues, so expectations for upside get nullified.
Due to the wide range of fluctuation, Now on weekly chart support has shifted at 10750 levels.
In the forthcoming week, 28 & 30 August are the critical dates.
Nifty Weekly Trading Levels
Next week 10915 will act as Resistance above which move towards 10970/11050/11185 can seen.
While Support is likely to come at, 10740 below that move towards 11685/11605/10470 can be seen.
Note: Above mention price projection & other Information are for educational purpose only.