We discussed the Last Nifty Intraday Chart Analysis. The range of 12010-12020 is the Resistance that the Bulls need to break to continue their upside journey.
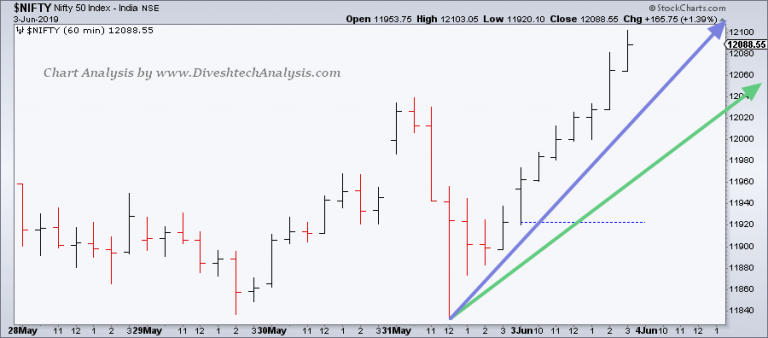
On Friday, Nifty fell almost 200 points in intraday from near the 12020 resistance level.
In this fall, Nifty made a low near 11829 and failed to move below 11790, which we discussed would act as support.
Yesterday, Nifty opened on a positive note and made a new lifetime high around 12100 levels.

At present, Nifty Bulls are in a strong position, and we can see further upside towards the 12180/12285 levels. Bears have their chance only below the 11900 price level.
Nifty Intraday Chart Analysis for 04th June
Today’s Intraday support is at 12030/11985/11890, and resistance is at 12110/12155/12240.
Note: The above-mentioned price projection & other Information are for educational purposes only.


