Nifty bears again trying hard…

There are ample of Cyclic Sign which are indicating there can be correction in Indian stock market before moving towards more up targets & Time projection shows this correction can start taking place from upcoming week (6-10th Nov)
On upside 10524 Price point can act as our 1st resistance, but this level is having its validity till 6th of Nov only after that if market still continues to move on higher side then 10675 can act as our 2nd resistance which will be valid till 10th Nov only, I have marked both these resistance Price Points on above chart
10320 Price Point will act as our strong support for the whole week, which I have marked on the above chart
Nifty Intraday Price Points…
Well Mr.Gann didn’t leave any Intraday charts that we know of, but still many of my Unique Trading Techniques have shown good results on Intraday charts also
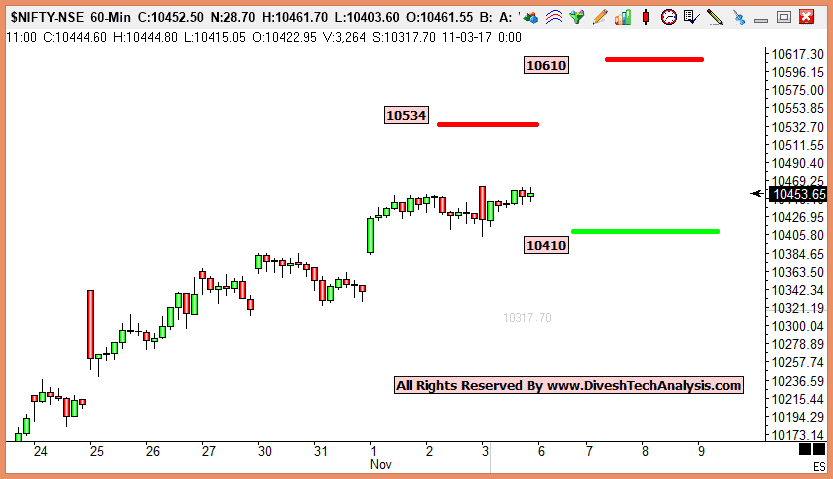
On Nifty Hourly chart 10534 & 10610 will act as good resistance points & 10410 can act as good support point, Please note Intraday Price Points are only valid for 6th of Nov after that there will be different Price Points
If you wish to have a little more insight, please sign up & become a member, Sign up form is available at bottom of page
It’s FREE to join with no obligations or spam solicitations. That’s not the mission here !
NOTE: These projections & views are not given in an advisory manner but only as an educational tool.
[contact-form to=”[email protected]” subject=”Newsletter Signup “][contact-field label=”Name” type=”name” required=”1″][contact-field label=”Email” type=”email” required=”1″][/contact-form]


