Each trading day presents a different kind of structure. And as a trader, we should have a well-tested plan and set-ups to deal with those structures.
And today’s market structure was rangebound, which is one of the most challenging structures to trade. But in such a situation also, our Rangebound trends method (RBT METHOD) picked the exact turn for the day.
So, let’s have a look at today’s Bank Nifty Intraday chart to understand how we traded in today’s difficult market.

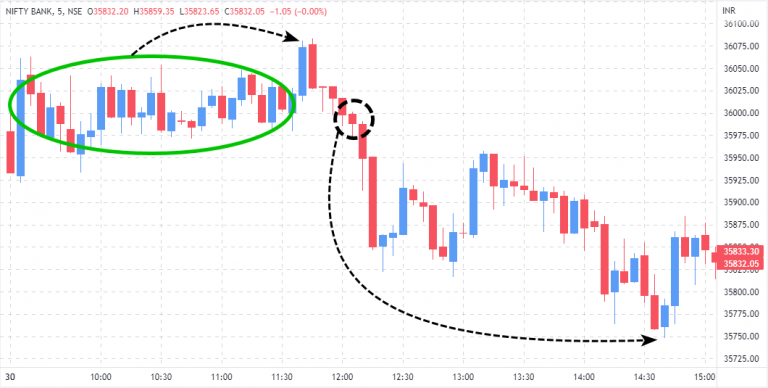
The Bank Nifty opened with a gap and started trading in a range. And that was the perfect opportunity to use that range structure to find the breakout trade for the day.
And the same happened. That sideways structure (which happened) after the market opening (see green oval) gave a solid signal for the sell trade around 12:00 pm. And from the sell point index fell nearly 200 points.
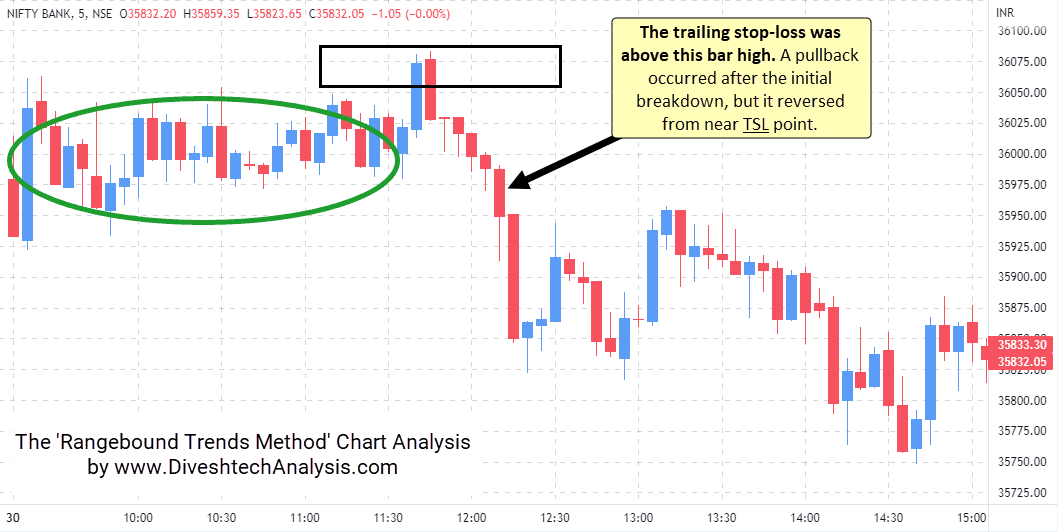
In fact, after the first break from the selling point, there was an up-move, but still, we held the position with confidence. The bank nifty moved up after the initial breakdown but didn’t hit the trailing stop-loss in that upside.

So, that’s one way to trade in markets where there is no clear trend. Every trader needs this skill because markets trade in a range most of the time.
Here is one more post on the Rangebound trends to help you understand its process: Profit Opportunities of Today’s Rangebound Market.
